Building Better Governance: A Utility's Project Management Transformation
A Real-World Case Study in Modern Project Governance
Blog Overview
Synopsis: The Challenge Executives May Experience
You open the status report. The capital project is over budget and running late! The regulators are asking pointed questions. Your project managers are working harder than ever, yet results remain inconsistent. Sound familiar?
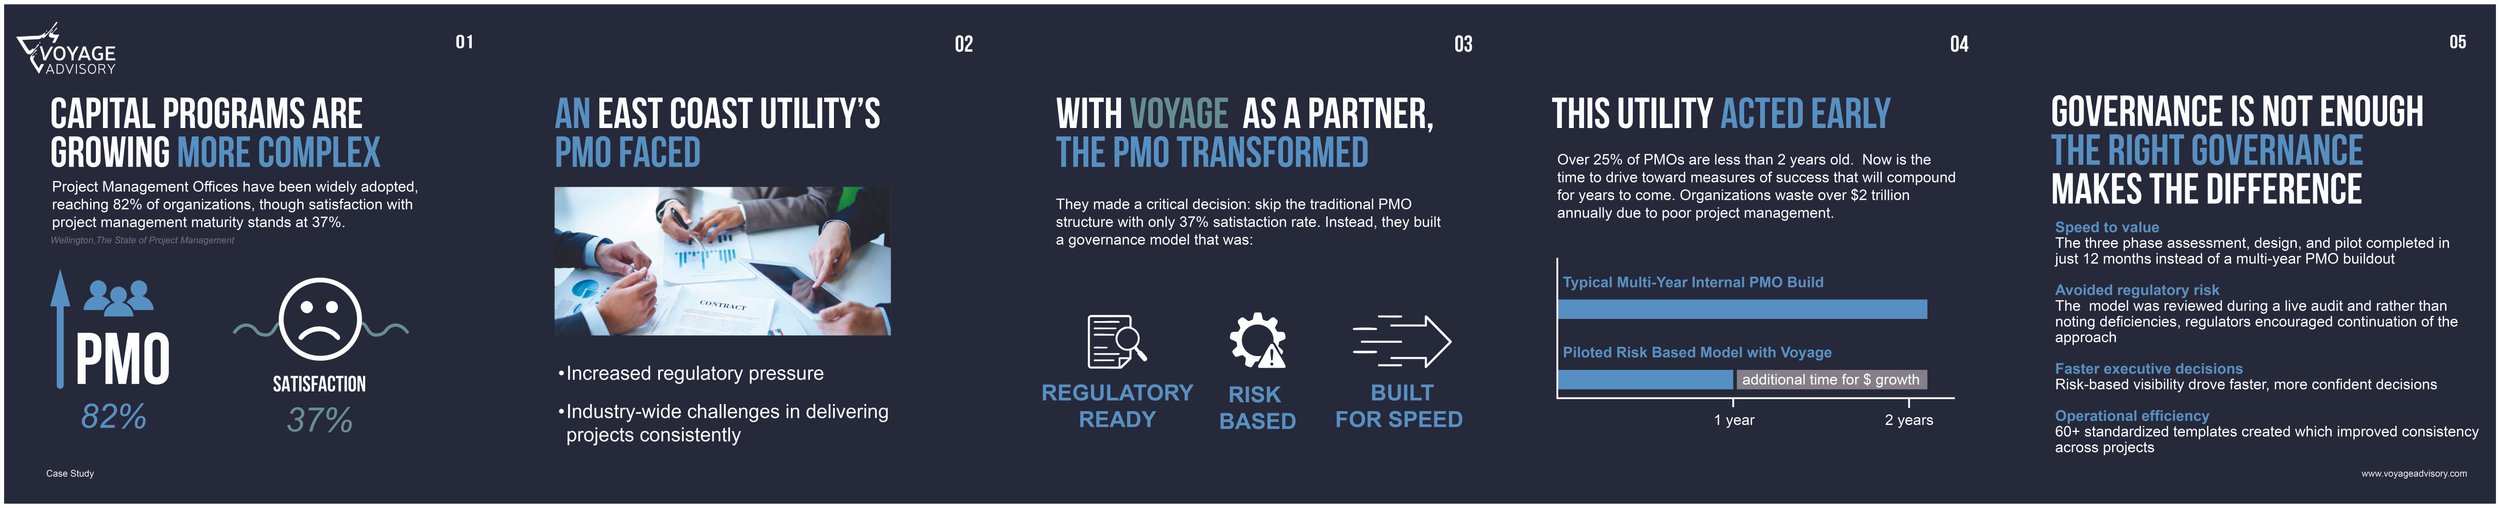
This is not a hypothetical scenario; it is the reality one electric utility faced when state regulators escalated their scrutiny over mounting cost and schedule variances across the utility's capital portfolio. With over 100 million transmissions, distribution, IT, and operational technology investments at stake, the organization needed more than incremental improvements. They needed a fundamentally different approach to project governance.
What makes this story compelling is not just that they succeeded, it is how they succeeded. Rather than implementing the heavy, procedural Project Management Office (PMO) that consultants often recommend, we helped to build something different within 6 months: a lightweight, risk-based governance structure that achieved regulatory approval while actually improving project outcomes
The Stakes Were High
The utility faced regulatory scrutiny, cost overruns averaging 27% industrywide, and the sobering reality that only 34% of organizations consistently complete projects on time and within budget. But they also had an opportunity: organizations with mature project management capabilities achieve 92% success rates compared to just 33% for underperforming organizations, a 3x improvement.
This case study shows how the utility transformed its project governance and explains why, in the context of broader industry trends, its approach represents the future of PMO strategy. It is not an outlier but a model that forward-thinking organizations are now racing to adopt.
The Industry View: Why Traditional PMOs Are Failing
To understand why this approach was so effective, we need to examine what is happening across the project management industry. The data tells a story of widespread PMO adoption coupled with widespread dissatisfaction, a disconnect that reveals fundamental problems with traditional governance models.
The Adoption Satisfaction Paradox
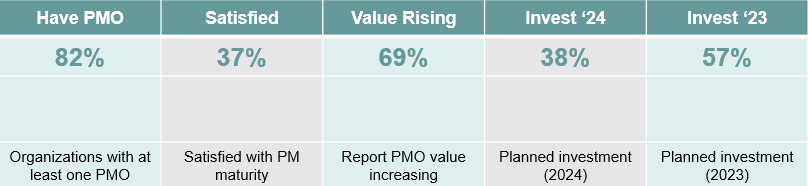
Project Management Offices have become universal. According to Wellingtone's 2024 State of Project Management report, 82% of organizations now have at least one PMO, up from 71% in 2016. Yet despite this widespread adoption, only 37% of organizations are satisfied with their project management maturity.
Even more telling: PMO investment plans dropped from 57% to 38% year over year. Organizations are not abandoning project governance; they are recalibrating their approach. A quarter of today's PMOs are less than 2 years old, indicating that companies are actively experimenting with new governance models.
Chart 1: The PMO Adoption vs. Satisfaction Gap
The disconnect between PMO prevalence and organizational satisfaction.
Source: Wellingtone, The State of Project Management 2024
The data reveals several critical trends:
82% of organizations have PMOs, but only 37% are satisfied with PM maturity
Organizations waste $1 million every 20 seconds due to poor project management, approximately $2 trillion annually
Only 34% of organizations consistently complete projects on time and within budget
Project cost overruns average 27% across all industries
BUT: Organizations with mature PM capabilities achieve 92% success rates vs. 33% for immature organizations
Chart 2: Project Success Rates by Organization Maturity
Mature organizations achieve 3x better outcomes.
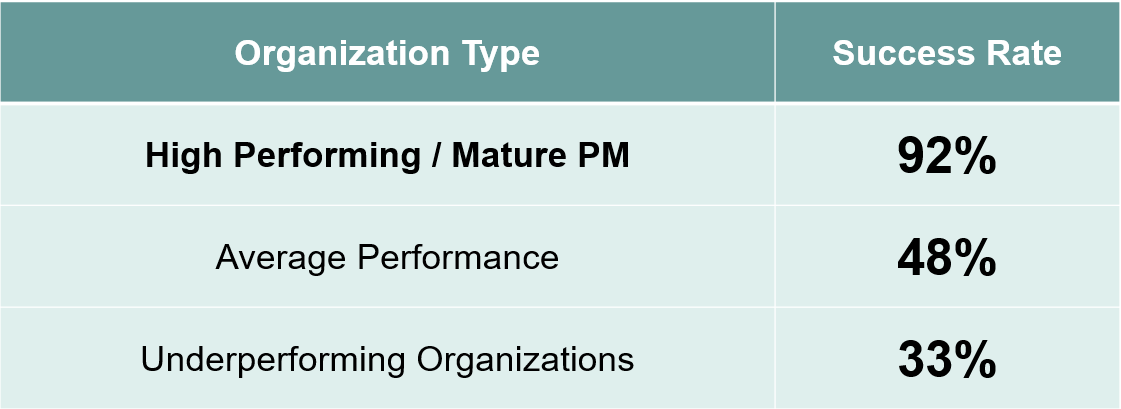
Source: PMI Pulse of the Profession 2024; PM Solutions
The message is clear: it is not whether organizations need governance, it is what type of governance actually delivers results.
Five Trends Reshaping Modern Governance
1. Risk Based Governance Replacing Universal Oversight
Organizations are abandoning the 'govern everything equally' approach. Only 40% of project governance activities are considered very effective (KPMG, 2020), prompting a shift toward tiered oversight where high-risk projects receive intense scrutiny while low-risk initiatives run with minimal interference.
2. Capability Building Over Dependency
The most significant shift is the focus on building internal capability rather than creating dependency on the PMO. High-performing organizations are 2.2x more likely to have formal training programs. PMOs with training programs jumped from just 11% in 2014 to 60% in 2024.
Chart 3: PMO Training Programs Evolution
High performers are 2.2x more likely to have training programs.
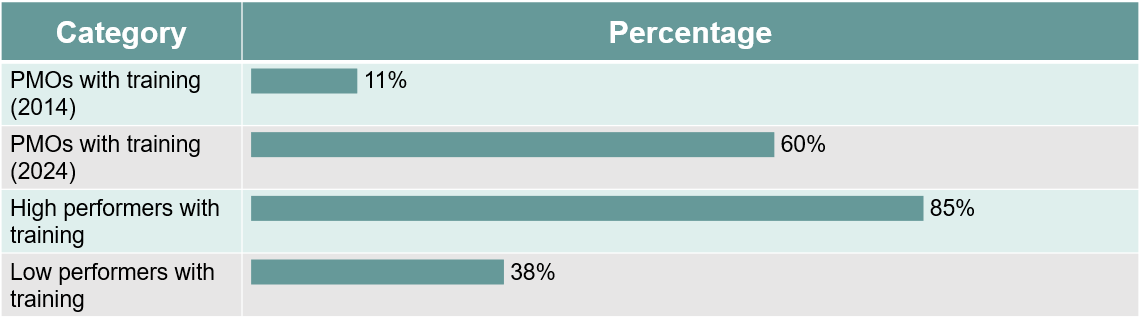
Source: Wellington State of Project Management
3. Speed and Executive Sponsorship as Critical Success Factors
Decision velocity matters. Projects with leadership decision making under 1 hour achieve 58% success rates compared to significantly lower rates when decisions lag (Scrum Inc), the underlying driver is simple: active sponsors consistently deliver stronger results than traditional approval chains.
4. Pilot Test Scale Approach vs. Perfect Planning
Organizations are embracing iterative implementation. With 25% of PMOs less than 2 years old, companies are testing governance models with pilot projects, gathering feedback, and optimizing before full rollout, moving 45% faster than traditional 'perfect plan first' approaches.
5. Hybrid Methodologies Over Ideology
The methodology wars are over, pragmatism won. While 43.9% of organizations still use traditional/Waterfall approaches, 31.5% now use hybrid models (the fastest growing segment), and 24.6% use pure Agile. Organizations are blending approaches based on project needs rather than ideological commitment.
Chart 4: Project Management Methodology Distribution
Hybrid approaches are the fastest-growing segment.
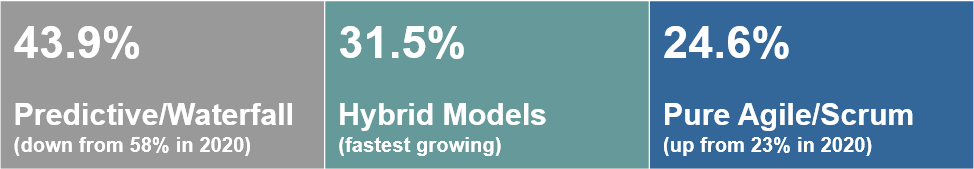
Source: Wellingtone 2024
Why Utilities Face Unique Governance Pressures
The utility industry faces a perfect storm of challenges that make effective project governance not just important, but mission critical. Understanding these pressures helps explain why this particular utility's governance transformation was so urgent, and why their solution needed to be different from standard PMO implementations.
Explosive Demand Growth
The demand for peak electricity is projected to grow by 26% by 2035, driven by data centers, AI workloads, electrification in transportation and industry, and industrial growth (Deloitte, 2026). Data center demand alone could reach 176 gigawatts by 2035, a fivefold increase from 2024.
Intensifying Regulatory Scrutiny
With average residential retail electricity prices projected to be 4.5% higher in 2025 compared to 2024, regulators are demanding transparent governance proving that ratepayer dollars are being spent prudently. Every cost overrun, every schedule delay, becomes a regulatory concern.
Capital Intensive, Multiyear Projects
Software companies can pivot quickly. Utilities cannot. Capital projects involve multimillion-dollar investments in physical infrastructure, transmission lines, substations, distribution systems, and operational technology. These projects take years and involve complex stakeholder relationships and technical dependencies.
Public Safety and Reliability Stakes
Poor project management in utilities does not just waste money, it can directly impact grid reliability and public safety. The consequences of governance failures extend far beyond cost overruns to potential service disruptions affecting thousands or millions of customers.
Chart 5: Utilities Sector Challenges & Projections
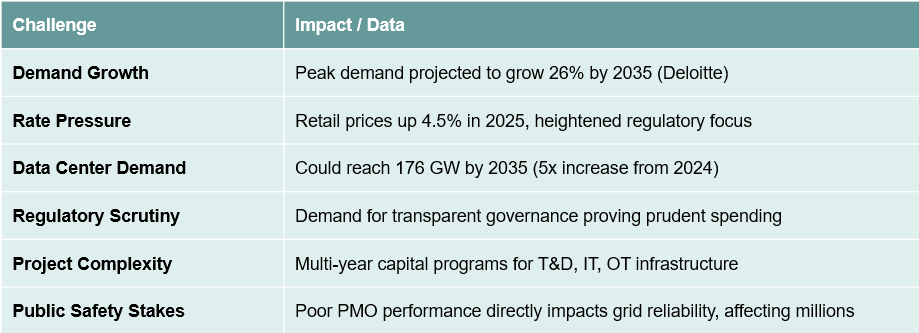
Source: Deloitte 2026 Power & Utilities Outlook, EY
The Utility Project Governance Gap
The utility sector's challenge: execute massive capital programs (transmission, distribution, IT, OT) under intense regulatory scrutiny, with projects that cannot be easily redirected or abandoned, while managing public safety risks and demonstrating prudent spending to ratepayers. Risk management maturity is significantly lower than all other PM knowledge areas (Pennypacker, 2002), a critical gap in an industry where risk mitigation directly impacts public safety and regulatory compliance.
This was the environment the utility operated in when regulators escalated their scrutiny. They needed governance that worked, and they needed it fast.
The Solution: A 3 Phase Approach
The utility faced regulatory pressure and industry-wide project failure rates. They made a critical decision: skip the traditional PMO structure. Instead, they built a lightweight, risk-based governance model for high-risk projects and left low-risk initiatives alone.
The transformation unfolded in three distinct phases over approximately 12 months, with remarkable speed and impact.
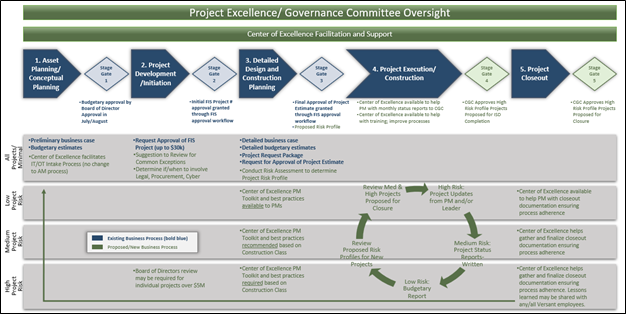
Chart 6: Project Phase Moving Forward:
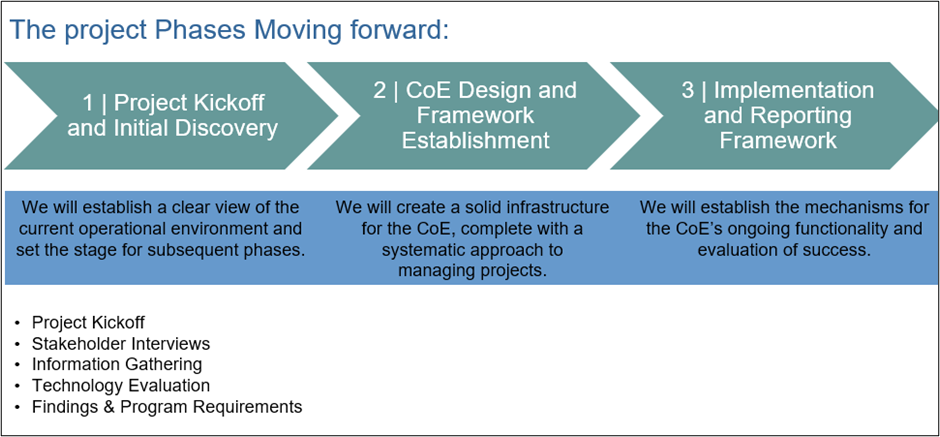
Phase 1: Maturity Assessment & Gap Analysis
The utility started with a maturity assessment of its project and program management capabilities. This was not a superficial evaluation; it was a deep dive into how the organization actually managed projects across all capital types: Transmission, Distribution, IT, and Operational Technology.
Key findings revealed:
• Missing foundational portfolio oversight is commonly found in peer organizations
• Gaps in project initiation processes, projects often started without clear risk profiles
• Inconsistent detailed project planning across different project types
• Weak project closeout processes, lessons learned were not systematically captured
• Lack of standardized templates forcing experienced PMs to recreate documentation from scratch
Chart 7: Maturity Assessment Heatmap
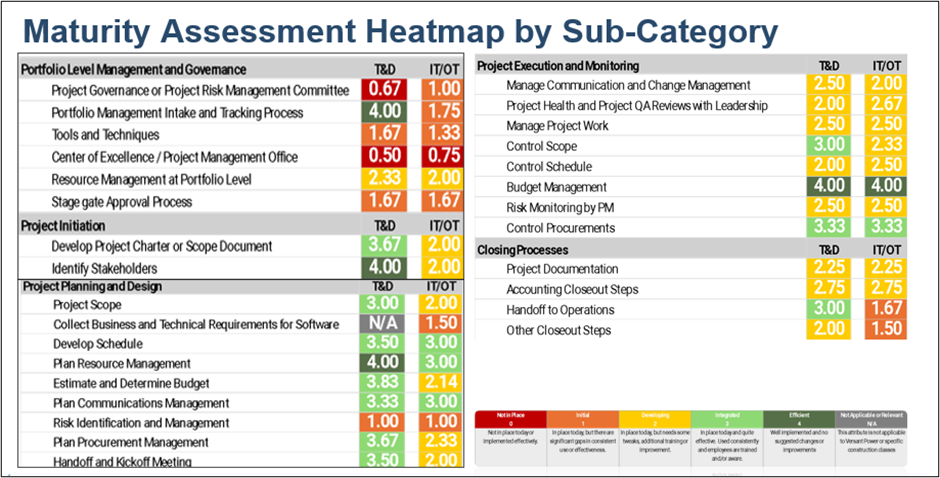
Critically, the assessment confirmed that a full PMO was not the answer. The organization needed targeted governance, not bureaucratic overhead.
Phase 2: Design & Pilot Implementation
With the gaps identified, the utility moved quickly to design and test a new governance model. The design phase addressed five critical components:
Component 1: Risk Based Project Selection
A project risk rating tool was developed to help project managers assess risk profiles at project onset using quantitative and qualitative attributes based on feedback from seasoned project leaders and industry best practices. The level of risk determines the level of governance, high-risk and medium-risk projects receive new rigor, while low-risk and minimal-risk projects experience no process changes.
This mirrors the industry trend away from universal oversight, focusing resources where they matter most.
Component 2: Project Excellence
The utility skipped creating a separate PMO department. Instead, they formed a Project Excellence Committee (also referred to as a Center of Excellence) with senior directors responsible for capital portfolio success. The committee drafted and adopted a charter and bylaws.
The committee established a monthly review cadence for high-risk projects, using tailored status templates and dynamic financial summaries created in collaboration with Financial Planning and Analysis to track budget changes against original plans.
Chart 8: Risk-Based Project Management Approach
Component 3: Tiered Requirements by Risk Level
Templates and reporting frequencies vary by project type and risk. A complex construction project needs different templates and more frequent reports than a medium-risk IT project. This approach avoids the one-size-fits-all trap that bogs down traditional PMOs.
Component 4: Comprehensive Template Library
To stop PMs from reinventing basic tools, the consulting team, working with the utility created 60 templates across 15 areas, including:
• Business Case and Cash Flow Modeling
• Project Communications
• Project Kickoff Meetings
• Project Scheduling
• Project Scoping and Charters
• Risk, Action Items, Issues and Decision Logs
These templates ranged from simple versions for small projects to advanced templates for complex initiatives. The templates came with instructions and best practices, building capability, not dependency. This aligns with the industry finding that 60% of PMOs now have formal training programs, and high performers are 2.2x more likely to provide training resources.
Component 5: Quality Assurance - 'Inspect What You Expect'
Following the principle attributed to management specialist Lawrence Appley, the governance model included monthly status reports and detailed project reviews prior to execution phase and upon completion. Metrics and KPIs were designed to monitor the governance model's effectiveness itself, ensuring the oversight system stayed relevant and added value.
The Pilot Approach: Speed Over Perfection
Rather than trying to perfect every detail upfront, the utility applied the new governance structure to a subset of large capital projects during a pilot phase. Project participants provided feedback, the team made small tweaks to optimize the approach, and learnings informed the full rollout. This iterative approach, consistent with the industry trend toward pilot test scale methodology, enabled the team to complete maturity assessment, model design, and pilot rollout within six months.
Phase 3: Full Rollout & Training
Once the pilot phase validated and optimized the governance model, the utility moved to companywide implementation. This phase focused on training and adoption across the entire capital project management team, supported by a detailed month by month roadmap of tasks for user adoption.
Critically, during Phases 2 and 3, the client underwent an operational audit by State regulators who evaluated all aspects of the utility's operations. The governance work was examined in detail, and regulators encouraged the utility to continue implementing its planned approach to reduce project risk through the new governance model, powerful validation that the approach satisfied regulatory requirements.
The Secret Ingredients: What Made This Work
The transformation succeeded due to four critical factors: (1) Avoiding Analysis Paralysis - embracing the pilot concept rather than striving for perfection; (2) Invested Business Sponsors - active involvement, swift decisions, roadblock removal; (3) Talented Project Leads - experienced industry professionals who could navigate decisions quickly; (4) Experienced PM Participation - skilled program and project managers provided stakeholder feedback and contributed existing knowledge. Speed: maturity assessment, design, and pilot in six months.
Results: What Changed and Why It Matters
The pilot phase and subsequent rollout delivered measurable improvements across multiple dimensions. More importantly, these results were achieved without creating the bureaucratic overhead that often characterizes traditional PMO implementations.
Immediate Wins: Transparency and Consistency
Increased Transparency Across Projects
Committee members gained clear understanding of project progress, risks, and outcomes across all pilot projects. This transparency allowed participants to see the new model in action and identify optimization opportunities before full rollout. For regulators, this visibility demonstrated prudent oversight of ratepayer dollars.
Standardization with Customization
The framework introduced consistency across pilot projects through standardized processes and practices, enhancing efficiency. Simultaneously, it allowed tailored customization to meet unique project needs, the balance that traditional PMOs often fail to achieve. High-risk transmission projects received different oversight than medium-risk IT implementations.
Improved Documentation
With 60 templates and instructions now readily available, project managers stopped recreating documentation from scratch. This improved documentation proved invaluable for both external regulatory reviews and internal references. Knowledge began accumulating systematically rather than residing in individuals' heads.
Strategic Wins: Capability Building and Adaptability
Internal Capability Development
Rather than creating dependency on consultants or a central PMO department, the governance model built internal capability. Project managers now had templates, training, and clear processes. The organization was positioned for continuous improvement as capabilities matured over time, exactly the approach high performing organizations use (85% have formal training programs vs. 38% of low performers).
Flexible, Adaptive Framework
The governance model was designed with flexibility in mind, recognizing that the utility's project portfolio changes each year. The risk rating tool can flex thresholds as the portfolio composition shifts. This adaptable structure allows the utility to respond to evolving project demands and priorities—ensuring the framework remains relevant rather than becoming bureaucratic overhead.
Month by Month Adoption Roadmap
To ensure successful adoption, a detailed roadmap outlined necessary steps for user adoption and preparation for companywide rollout. This structured approach to change management addressed the 'people' side of governance transformation, often the factor that determines whether new processes stick or fade away.
Ultimate Validation: Regulatory Approval
During the operational audit by State regulators—conducted while the governance transformation was underway, the new model was examined in detail. Rather than finding deficiencies, regulators encouraged the utility to continue implementing its planned approach. This regulatory endorsement validated that lightweight, risk-based governance could satisfy compliance requirements while improving project outcomes.
Six Critical Actions for Executive Leaders
Drawing from this case study and the broader industry trends, here are six essential actions executive leaders must take to build a PMO environment that delivers results without bureaucratic overhead.
1. CHAMPION RISK-BASED GOVERNANCE OVER UNIVERSAL OVERSIGHT
Focus governance resources on high-risk projects while allowing low-risk initiatives to run with minimal oversight.
2. MAKE SWIFT DECISIONS AND REMOVE ROADBLOCKS RELENTLESSLY
Projects with leadership decision making under 1 hour achieve 58% success rates. Your executive sponsorship must remove obstacles quickly so project teams can maintain momentum. This action is nonnegotiable.
3. INVEST IN KEY RESOURCES (I.E., TRAINING, TEMPLATES, AND CAPABILITY BUILDING)
High-performing organizations are 2.2x more likely to have formal PM training programs. Provide comprehensive templates, instructions, and training that build capability rather than creating dependency. This action is nonnegotiable.
4. EMBRACE PILOT-TEST-OPTIMIZE OVER PERFECT PLANNING
Test new approaches with pilot projects, gather feedback, optimize, then scale. This moves 45% faster than traditional implementations.
5. DESIGN FOR FLEXIBILITY, NOT RIGIDITY
Your project portfolio will change annually, so your governance framework must adapt. Build governance that can flex with changing portfolio composition, emerging technologies, and evolving business priorities.
6. MEASURE WHAT MATTERS AND MAKE DATA VISIBLE
Establish KPIs that track both project outcomes and governance effectiveness. Organizations with PM maturity achieve 92% success rates because they measure and monitor the right things. This action is nonnegotiable.
Conclusion: The Future of Project Governance
The utility's success story is not unique because they solved an impossible problem, it is unique because they resisted the conventional wisdom that told them to implement a traditional, heavy PMO structure. Instead, they built something better: a lightweight, risk-based governance framework that satisfied regulators, improved project outcomes, and built internal capability.
The broader industry data validates their approach. With 82% of organizations having PMOs but only 37% satisfied with their PM maturity, it is clear that simply having governance is not enough, having the right kind of governance makes all the difference. Organizations with mature PM capabilities achieve 92% project success rates compared to just 33% for underperforming organizations. That is not a marginal improvement. That is transformation.
High Level Key Takeaways
1. Risk-based governance works. Focus resources on high-risk projects rather than applying maximum oversight to everything. With only 40% of universal governance activities considered effective, tiered oversight delivers better results with less overhead.
2. Speed matters more than perfection. Projects with leadership decision making under 1 hour achieve 58% success rates. The pilot test optimized approach moves 45% faster than traditional 'perfect plan first' methods and incorporates real-world learning.
3. Build capability, not dependency. High performers are 2.2x more likely to have formal training programs. Providing comprehensive templates, training, and resources builds internal capability that compounds over time rather than creating ongoing reliance on consultants.
4. Flexibility beats rigidity. Your project portfolio will change. Your governance framework must be adapted. Organizations using hybrid methodologies (31.5% and fastest growing segment) report better adaptability than those locked into single approaches.
5. Executive sponsorship is non-negotiable. Swift decisions, active roadblock removal, and visible commitment from leadership determine whether governance transformation succeeds or becomes another failed initiative. Your involvement matters.
6. Establish KPIs that track both project outcomes and governance effectiveness. Organizations with PM maturity achieve 92% success rates because they measure and monitor the right things. This action is nonnegotiable.
The Path Forward
For utilities facing similar regulatory pressures, with 26% demand growth projected by 2035, 4.5% retail price increases intensifying scrutiny, and massive capital programs to execute, the message is clear: traditional PMO structures will not deliver the results you need. You need governance that is lightweight enough to avoid systematic drag but rigorous enough to satisfy regulators and actually improve project outcomes.
For organizations in any industry watching projects after projects miss cost and schedule targets, you are not alone. Organizations waste $2 trillion annually due to poor project management. But the solution is not more governance, it is better governance. Risk-based. Capability-building. Flexible. Fast.
The industry is at an inflection point. With 25% of PMOs less than 2 years old, organizations are actively experimenting with new models. The question is not whether to implement governance, it is whether you will choose the bureaucratic approach that contributes to the 37% satisfaction rate, or the modern approach that drives organizations toward the 92% success rate of mature PM capabilities.
The utility in this case study made their choice. They completed maturity assessments, designed a new model, and rolled out a pilot in six months. They satisfied regulators. They improved project outcomes. They built internal capability that will compound for years to come.
What choice will you make?
Written by Roger LaGrone
References & Data Sources
Wellingtone (2024). The State of Project Management 2024.
Project Management Institute (2024). Pulse of the Profession 2024.
Harvard Business Review (2024). Project Success Rate Research.
PM Solutions. Project Management Maturity Benchmark Studies.
KPMG (2020). Project and Program Governance Study.
Scrum Inc. Decision Lag and Project Failure Study.
Deloitte (2026). Power and Utilities Industry Outlook 2026.
Pennypacker, J.S. (2002). Benchmarking Project Management Maturity. PMI Research Conference.