



Automation
95%
of AI pilots fail
Not because the algorithms do not work, but because the problems were never worth solving. MIT, 2025.
Read door one
We engineer, build, and measure against a business case targeting a 3:1 return in year 1, then we track it every step of the way.
Where we go deep
Contact Center
Volumes rise, expectations rise faster, and every channel added is another place to be inconsistent. AI helps only where the work underneath it is already sound.
Every conversation resolved, at a cost that holds.
ExploreOperations
The work behind the promise is where cost accumulates and errors hide. Automation pays only once the process beneath it is worth automating.
Lower cost to serve, with no drop in service.
ExplorePrograms
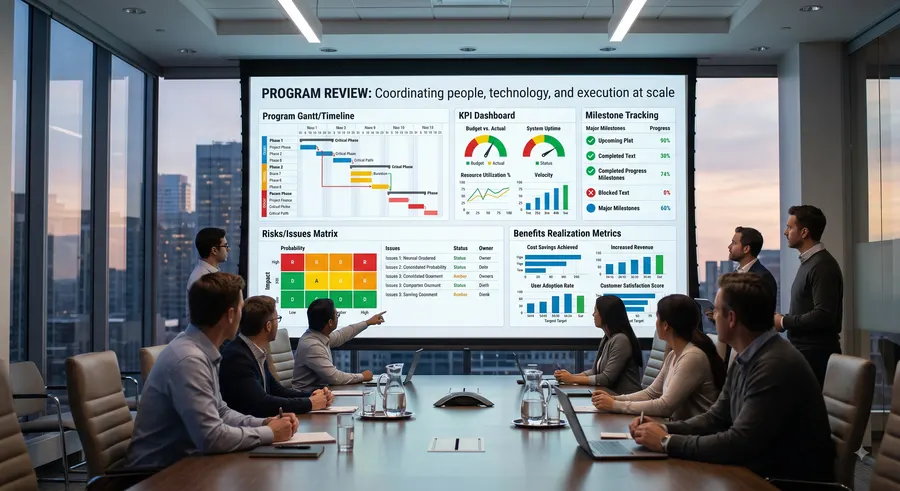
Large programs fail slowly and in plain sight. Governance, sequencing and delivery discipline decide whether the plan survives contact with the organization.
Delivered on schedule, and provably worth it.
ExploreDepth by industry, depth by service
Choose an industry, a service area, or the cell where the two meet.
What is changing
Automation, expectations, accountability, and cost are moving at the same time. The figures below are drawn from research and the work behind them.
Automation
95%
Not because the algorithms do not work, but because the problems were never worth solving. MIT, 2025.
Read door oneExpectations
60-70%
In the digital channels we have analyzed for clients, most interactions end at the phone anyway. Voyage analysis.
Read the articleAccountability
37%
Though 82% now run a PMO, and investment plans fell from 57% to 38% in a year. Wellingtone, 2024.
Read the caseCost & capacity
$20B10-20% more calls
Agencies field 10-20% more calls than commercial businesses and resolve 60-70% on first contact, against 80-90%.
Read the paperWhat success looks like
Focus on getting the technology live. Or focus on getting the value out of it.
The software goes in, configured and trained to a working baseline. What happens to the process is left to you.
Everything in Option A, plus the process, adoption and measurement work that turns the deployment into a number you can defend.
| What is included | A | B | Risk accepted under A |
|---|---|---|---|
| Standard deployment | |||
| Implementation | Included | Included | |
| Initial configuration | Included | Included | |
| Basic training | Included | Included | |
| Value realization | |||
| Business case and baseline | Not included | Included | Success is undefined, so benefits cannot be claimed |
| Process redesign | Not included | Included | Old process, new screens |
| Change management | Not included | Included | Adoption stalls, workarounds harden |
| Targeted training | Not included | Included | Users learn the tool, not the job |
| Management routines and coaching | Not included | Included | Automation runs, people do not change, benefit is zero |
| Ongoing configuration | Not included | Included | Drift from rates, rules, and policy |
| Benefit measurement | Not included | Included | Return cannot be proven or defended |
| Next use case selection | Not included | Included | Value stops at the first use case |
| Overall cost, illustrative1 | $10 | $12 to $14 | On $1M of software, $200K to $400K in services |
| Meets or exceeds objectives2 | 13% | 88% | The gap is the change work, not the software |
| AI pilots with measurable P&L impact3 | 5% | TBD4 | Failures trace to workflow and adoption, not model quality |
Our team's experience
The work is different. The standard is the same: measurable value.
Health insurance provider · 4 sites
Our team assessed operations across four contact centers for a health insurance provider, establishing productivity metrics and custom training that cut average speed of answer from 3 minutes to under 1 minute, delivering about $1.2M in annual labor savings.
Global outsourcer · 100,000 agents
Our team led a program in a 100,000-agent global outsourcing environment to automate manual quality functions with advanced analytics, cutting quality staffing costs by more than half while improving performance insight and compliance.
Top 10 US P&C insurer
For a top 10 US property and casualty insurer, our team completed detailed time studies, redesigned processes, and trained management teams, achieving a 15-20% reduction in direct labor costs across underwriting and processing.
PE-owned manufacturer
Our team developed a strategic growth plan for a PE-owned manufacturer targeting a $10M annual EBITDA improvement, boosting valuation and contributing to a successful $250M sale.
State government insurance agency
Our team created comprehensive process maps, requirements, and a modernization roadmap for a state government insurance agency, enabling a successful system implementation after multiple prior attempts, each exceeding $10M, had failed.
Top 3 global logistics company · 19 sites
Our team directed a global efficiency program spanning 19 contact centers for a top 3 global logistics company, establishing the PMO and Center of Excellence that delivered targeted savings toward a $99M annual goal.